Case study: analytics implementation across TVP's digital services
Telewizja Polska (TVP) runs traditional linear TV, but it also has a large digital ecosystem: many thematic websites, mobile apps and TV apps that generate millions of interactions every month. Managing such a scattered data architecture was a challenge that called for a well-organized analytics structure. This case study describes the end-to-end migration and unification of TVP's analytics, built around a Google Analytics 4 implementation.
The challenge
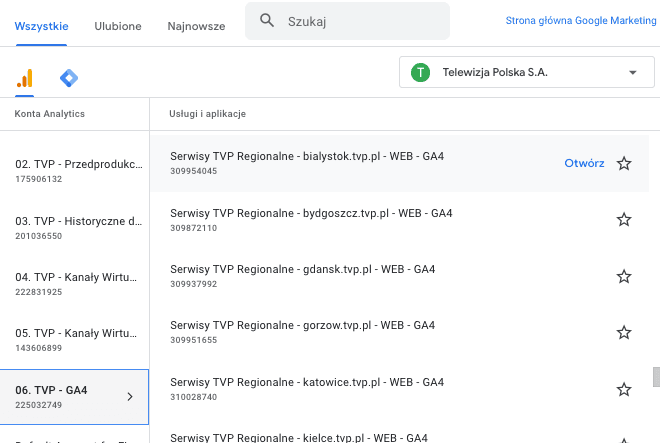
The main problem Telewizja Polska faced was severe data fragmentation. The organization manages more than 150 independent data streams in three categories:
WEB portals: dozens of thematic websites (from news to VOD).
Mobile apps (APP): dedicated Android and iOS apps.
TV apps (TV APP): apps for Smart TV platforms.
How do you measure campaign performance when mobile app data doesn't talk to website data? How do you assess the real engagement of a viewer who reads the news on their phone in the morning and watches a series on a Smart TV in the evening? Deploying a tool was the easy part. The real challenge was taming the information chaos and creating a single, consistent analytics language for the whole organization.
What we delivered
Our task was to design and implement an end-to-end data architecture that would bring all 150+ streams together into one consistent system. The overarching goal was to implement and configure a single, well-organized Google Analytics 4 (GA4) account.
An audit and inventory of all existing customer touchpoints (WEB, APP, TV APP).
A unified tagging plan (measurement plan) for all platforms.
Advanced data streaming to a central GA4 property.
Integration with BigQuery in the cloud
Reporting built on data from the data warehouse
How we did it
1. Audit and cross-platform testing
We ran rigorous tests across different operating system versions and device models. We checked whether the data was flowing, and also whether its structure in the streaming environment (often problematic because of how video players work) was consistent with the data from the news portals.
2. Complete technical documentation
We created full implementation documentation for every service. It became a roadmap for the development teams and ensures that every new addition to the ecosystem is compatible with the whole structure from day one.
3. Event standardization
The key to success was a universal event dictionary. Previously, the same user action (e.g. playing a video) could be named differently in the mobile app and on the website. We unified event names and parameters across all 150 streams. Now, whether a user presses "play" on a TV remote or on a smartphone screen, the system receives the same, comparable information. We also implemented consistent event firing logic: regardless of the technology, the same triggers (e.g. 25%, 50%, 75% of the content watched) send identically formatted data packets.
4. Cross-platform integration in GA4
Implementing GA4 at Telewizja Polska required a hybrid approach that would blur the line between browsers and native apps. Instead of building silos, we created a consistent data flow. Firebase ecosystem for APP and TV APP: for the mobile apps (iOS, Android) and Smart TV apps, we used the Firebase SDK. This made it possible to collect in-depth data on in-app user behavior, which is synced to GA4 automatically. As a result, TVP gained insight into retention and the journeys of users who watch video content on TV sets. On the websites, we implemented custom tracking that goes far beyond standard page views. We focused on measuring video player interactions, scroll depth and the micro-conversions that drive viewer engagement.
5. Validation and data quality
With more than 150 data streams, an error in one of them could distort the results for the entire group. Each of the 150 streams went through its own certification process. We checked tagging accuracy in isolation and in the context of the whole ecosystem, eliminating the risk of data duplication (e.g. the same events being counted twice where platforms overlap). We used scripts and tools for automated validation that checked the parameters being sent against our standard. Anomalies were caught before they reached the main analytics view. Instead of fixing data in reports, we focused on getting it right at the moment it is generated. This approach ensured that TVP's management works with numbers they can trust 100%.
6. BigQuery integration
This was the most technically advanced stage of the project. Given the volume generated by millions of viewers, the standard GA4 interface is only a starting point. The real analytical power lies in Google BigQuery. We set up the native data export from all 150 streams directly to the cloud data warehouse. This gives TVP access to raw data that is neither sampled nor aggregated. We built a reporting system based on direct SQL queries to BigQuery. It allows for analyses of any complexity that you couldn't click together in the GA4 interface, such as advanced attribution models or viewer LTV (Lifetime Value) analysis. With BigQuery, TVP can monitor program popularity and site load quickly and with high accuracy. The Google Cloud team described this approach in detail in a dedicated case study, as an example of using a data warehouse to manage huge datasets in the media sector (the TVP case study published by Google.)
7. Automated reporting
Deploying the technology is only half the job. The other half is making the data readable and useful for real-time decisions. At TVP's scale, where one minute of broadcast generates thousands of records, manual reporting was out of the question. We used Google BigQuery as the "engine" behind all the reports, which let us get around the limitations of the GA4 interface (such as row limits and data sampling). We built a system that queries the database automatically. For TVP's different departments (from the newsroom to the management board), we designed dedicated Looker Studio dashboards. They pull data directly from BigQuery, so the numbers shown are always up to date and consistent across the organization. Thanks to full automation, TVP gained insight into historical results and, more importantly, a tool for actively managing content and digital platforms based on hard data.
"With Looker, used by 200 Telewizja Polska employees, digital data analysis now drives decision-making across the whole organization. Visualizing content performance metrics lets the acquisitions team make informed purchasing decisions, which leads to a bigger share on Telewizja Polska's SVOD platforms and, in turn, higher viewer engagement and retention." Piotr Zimak, Head of Efficiency for Internet Platforms and Services at Telewizja Polska
Our work on this project was recognized by Google: the TVP case study published by Google. We are one of the few Polish companies with a joint publication with Google on thinkwithgoogle.com. Google recognized our project for Telewizja Polska, where we implemented the entire Google Analytics 4 infrastructure and the use of BigQuery data in real time.